Ola Fremming's homepage


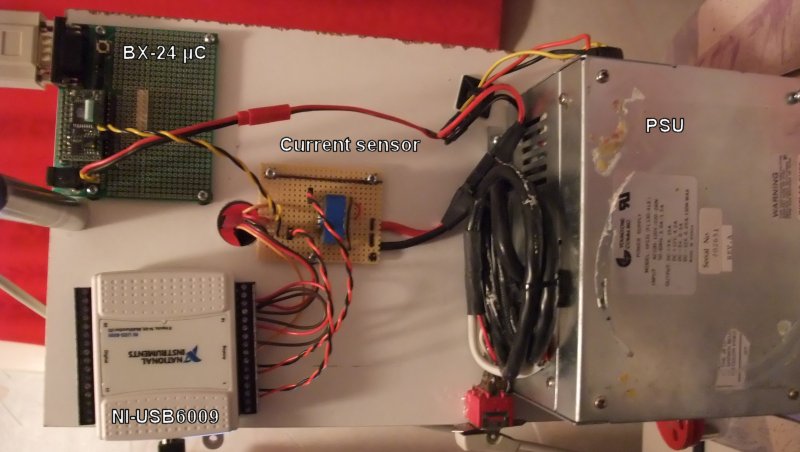
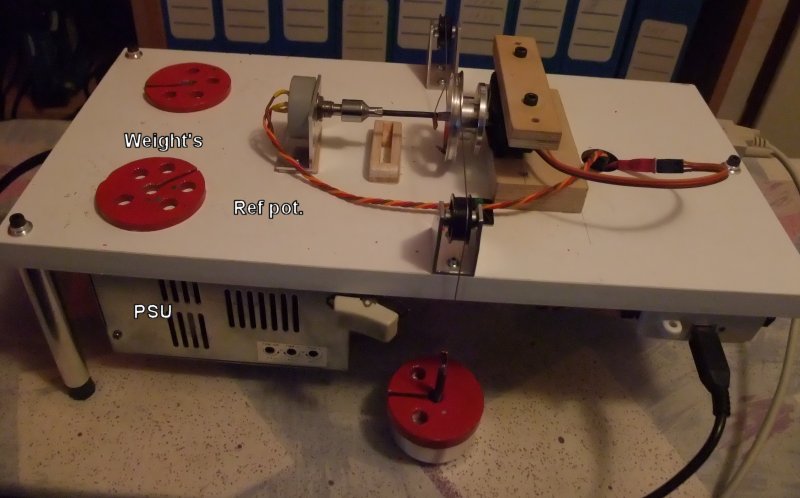
Servo testing

As part of the continuous task of keeping up and perhaps improving my level of competitiveness in F3A I have started to look seriously into the servos.  I find it very hard to do meaningful comparisons of the spec's that the manufacturers supply us with. Not that I have problems to read the numbers, but more if these figures are worth comparing at all.  As I am an engineer working with testing of sensor-devices, I know that it is more or less meaningless to compare figures if the test-methods are not the same.  And I am 100% sure that the manufacturers selects test-methods that yields the best possible numbers for their own products.  

Many years ago I used my EagleTree logger with a servo-current sensor attached to one servo at a time, to try to determine what kind of loads the servos do see during a typical F3A flight schedule.  The next step was to perform measurements on the servo's to understand what load the servos are exposed to during a flight.  I suspect that stories of blow-back of rudder servos during KE maneuvers and similar is exaggerated at the best.  To be able to test servos with a comparable result, I have then created the rig as described below.

The test-rig contains some major components : 

  • A PC-controlled servo-pulse generator

  • A precision potentiometer used to measure servo output angle.

  • A robust power to supply voltage to servo (PC PSU  5V 12A, 12 4A).

  • A current-to-voltage sensor (to enable servo-current measurement), LEM LTS 6-NP.

  • Pulleys, wires and weights to generate torque, I have made weights to generate torque in steps of 0.5[kg-cm].

  • A PC-connected data acquisition device (NI USB-6009) to measure current, voltage and position. 

Bottom side of the test-rig shows the BX-24 µC, the NI USB-6009, the current sensor and the PSU


Top-side with a servo mounted with pulley and weights attached to generate 1.5[kg-cm] of torque.


Top-side again showing the connection between servo and reference potentiometer, pulley and torqe generating weights.


So, what can be measure by using this rig ?  To take it one by one I have typically been doing these tests :

  • Deflection and current consumption at static load : Simply measure the current consumption while the servo is stationary.  Apply different static torques, and measure the current, and how far off from center that the servo is moved.  A side result from these kind of readings, are the internal update frequency of the servo. Modern 'digital' servos update the output (and draws current) at a much faster rate than it receives position-signals from the receiver.  Old 'analogue' servos updates the output each time a signal is received.

  • Sensitivity : How many degrees does the servo move per 1[ms] change in the input-signal pulse-length. A positive value means that the servo when seen from above rotates clockwise with an increasing pulse-length.

  • Deviation/linearity : This test moves the servo in steps of 2.5[°] and measures the position for each step. The difference in actual position compared to target position is measured an calculated.  The peak difference value is extracted, together with a graph showing the response. 

  • Accuracy : In this test the servo is moved slowly towards center, from both directions.  The difference in end-position when moving from each direction is presented.  This test is performed with different loads.

  • Sweep-speed : The servo is moved off to one side, then is moved as fast as possible to the other side.  During movement the position, current consumption and also the supplied voltage is measured. Post processing finds when the servo is 30° before and after center and thus calculates the time it takes for the servo to move over 60°.  In the time period between -30° and +30° the current consumption is averaged and presented together with peak value of the current consumption in the whole measurement sequence.  The speed are measured with different loads. One graph showing the whole movement and current consumption is presented.

  • Start-stop speed : The speed when moving without load from start at -X° to stop at +X°, this includes the time needed for starting and stopping the movement.

A typical test-result presentation contains these elements :

The general description contains references to the tested device, test-conditions, and also some general results.


Current consumption when servo is stationary is presented like this, one column with the applied torque, one with the average consumption and one that shows the angle deviation generated by the applied torque.


Accuracy when moving towards center, one column with the applied torque and one with the deviation angle between the two end-positions.


During speed measurements a lot of data is acquired, first column contains the applied torque, the next the measured speed, then the average current consumption when moving from-30 to +30°, and finally the peak current.


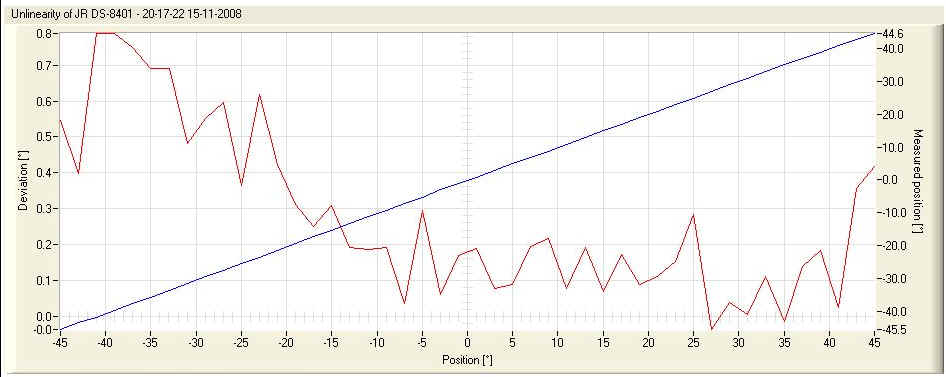
The position deviation (linearity) is also presented as a graph as shown below. The blue line shows the target positions, while the red one shows the servo's deviation from the target.


Also the last speed measurement is presented, blue line shows the servo position and the magenta the current consumption.  It is worth-while to make a note that the peak-current used to start the movement is far higher than the average current, and the peak value is close to independent of the servo-load.  The Current as presented below is slightly filtered to get a smooth curve, unfiltered the system is capable of measuring each current pulse that the servo's are sinking.  The last picture below show the same type of result as this one, but with unfiltered current.